Build Failure Duration

Build Failure Duration (BFD) - the time it takes to fix a broken build.
OK, but why is this important?
- When a build breaks we should not be able to deploy to stage/prod environment. It's a basic build pipeline rule (I think I first saw it in The Continuous Delivery book 10 years ago), because we're not sure of the qualities of the change we just made.
- We should not commit when the build is broken unless it is to fix the reason for breakage in the first place. There is just no way to know what causes subsequent build failures - the code that first broke the build or any subsequent changes. Check what lean manufacturing people call "stop the line" and andon cord. It's piling up more work on an already shaky foundation (this point is debatable as fixes are easier in software than in hardware - but will leave it for future post).
- Keeping the build green means you care for your co-workers. Imagine a scenario where you're pushing the last change for the day on Friday, just before your vacation next week. You're rushing through the door, not waiting for the result of the build (one of the reasons why you need fast builds). It fails. Best case scenario - your co-workers find out about the failure on Monday and instead of going about with their day, they are playing detective to figure out what went wrong on Friday. Worst case - an emergency hotfix needs to be deployed on Saturday, but the build is broken and we have no idea if it's any good. Detective game again but under pressure.
Ideally BFD should be zero, but in practice it is impossible. Besides code and unit tests related reasons there are a bunch of others that can cause a build to break:
- Infrastructure
- Network/Latency
- Flaky high level tests
- Artifact deployment
We should keep the failures above to a minimum. When a build fails it better be for the right reason and not a false positive. Otherwise developers start losing faith in the build system.
Build Failure Duration measures the intersection two important areas - how reliable is our build system and what is the engineering discipline of the team.
(A fast build helps with the latter, as at least you don't have to wait long for the result)
Measurement
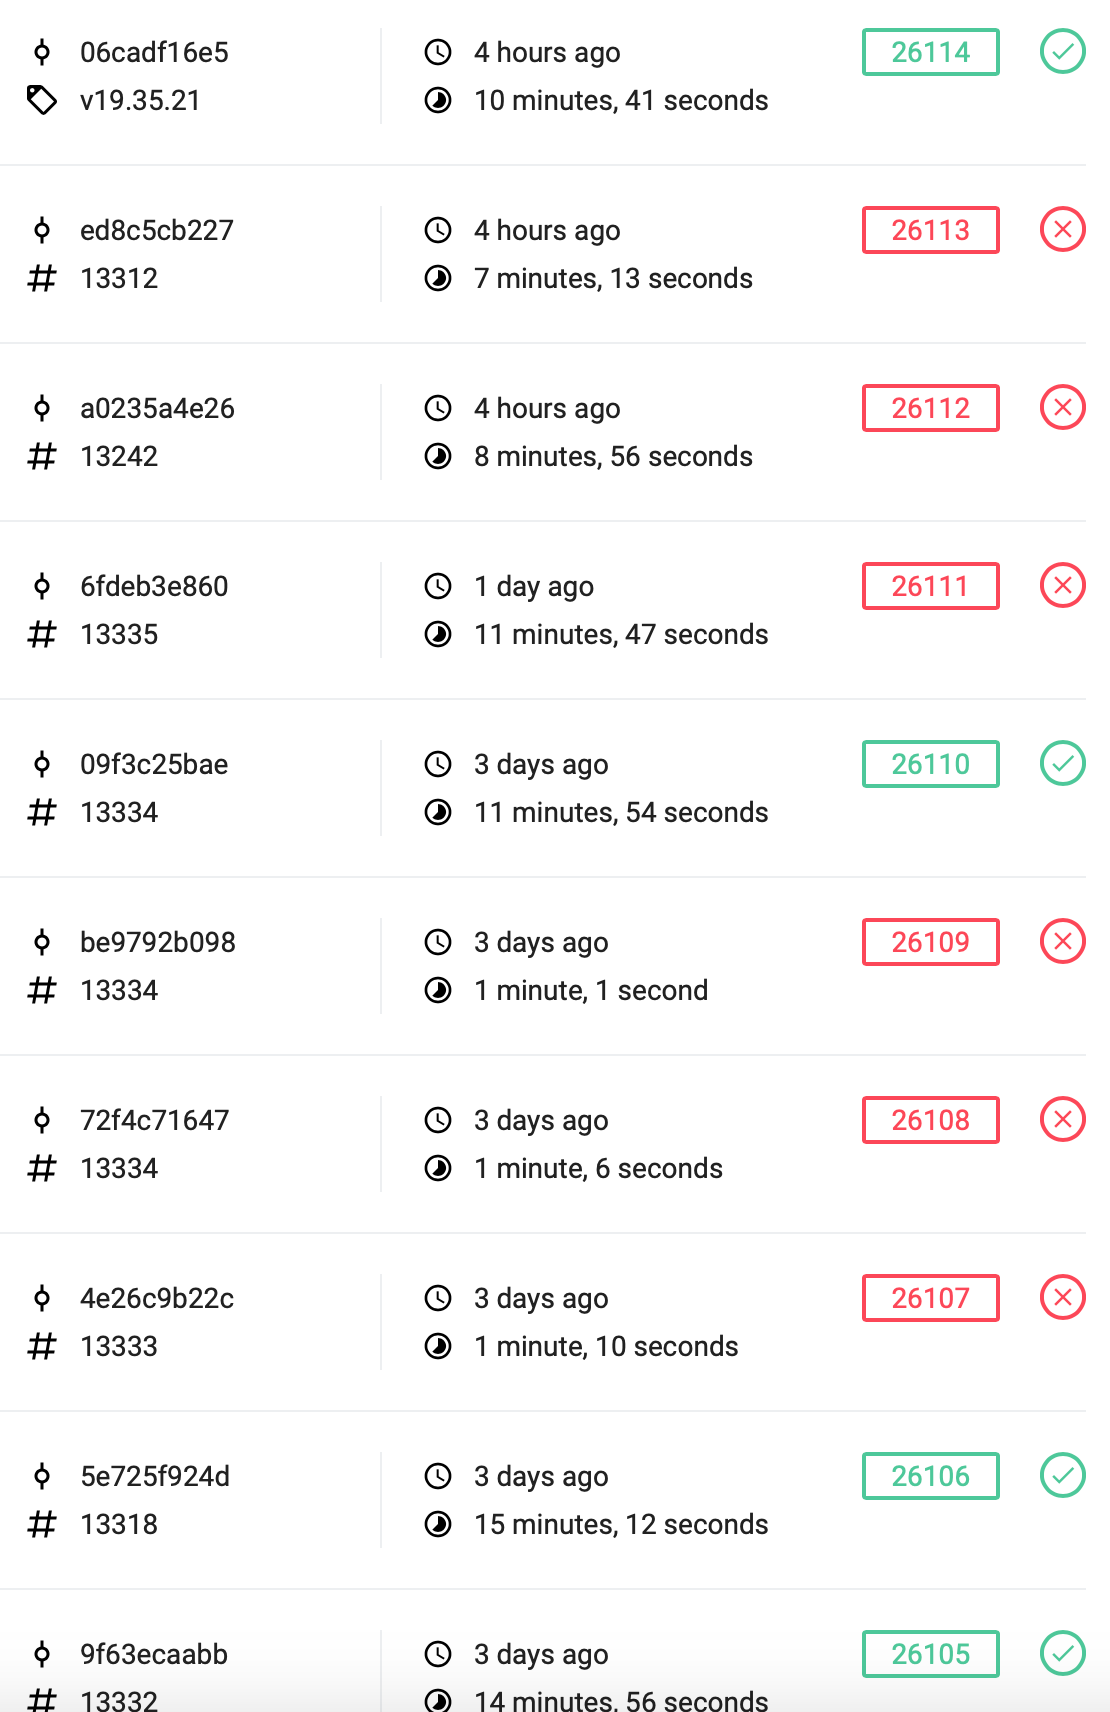
How do we measure the BFD? We extract all the build data from our CI system and sum up much time it takes from then the build first breaks until the first subsequent build that fixes the problem. If you have a (micro) service architecture then, teams are responsible for more than one build. At Falcon.io most product teams are responsible for 20 to 40 builds.
Next we add up all the build breakage times, for all the builds, for any given week and plot the results as a standard line chart enhanced with statistical process control limits to spot trends easily.
The first example is from one of Falcon.io's product teams. It is interesting to note the constant improvement that this team is applying in the past year.
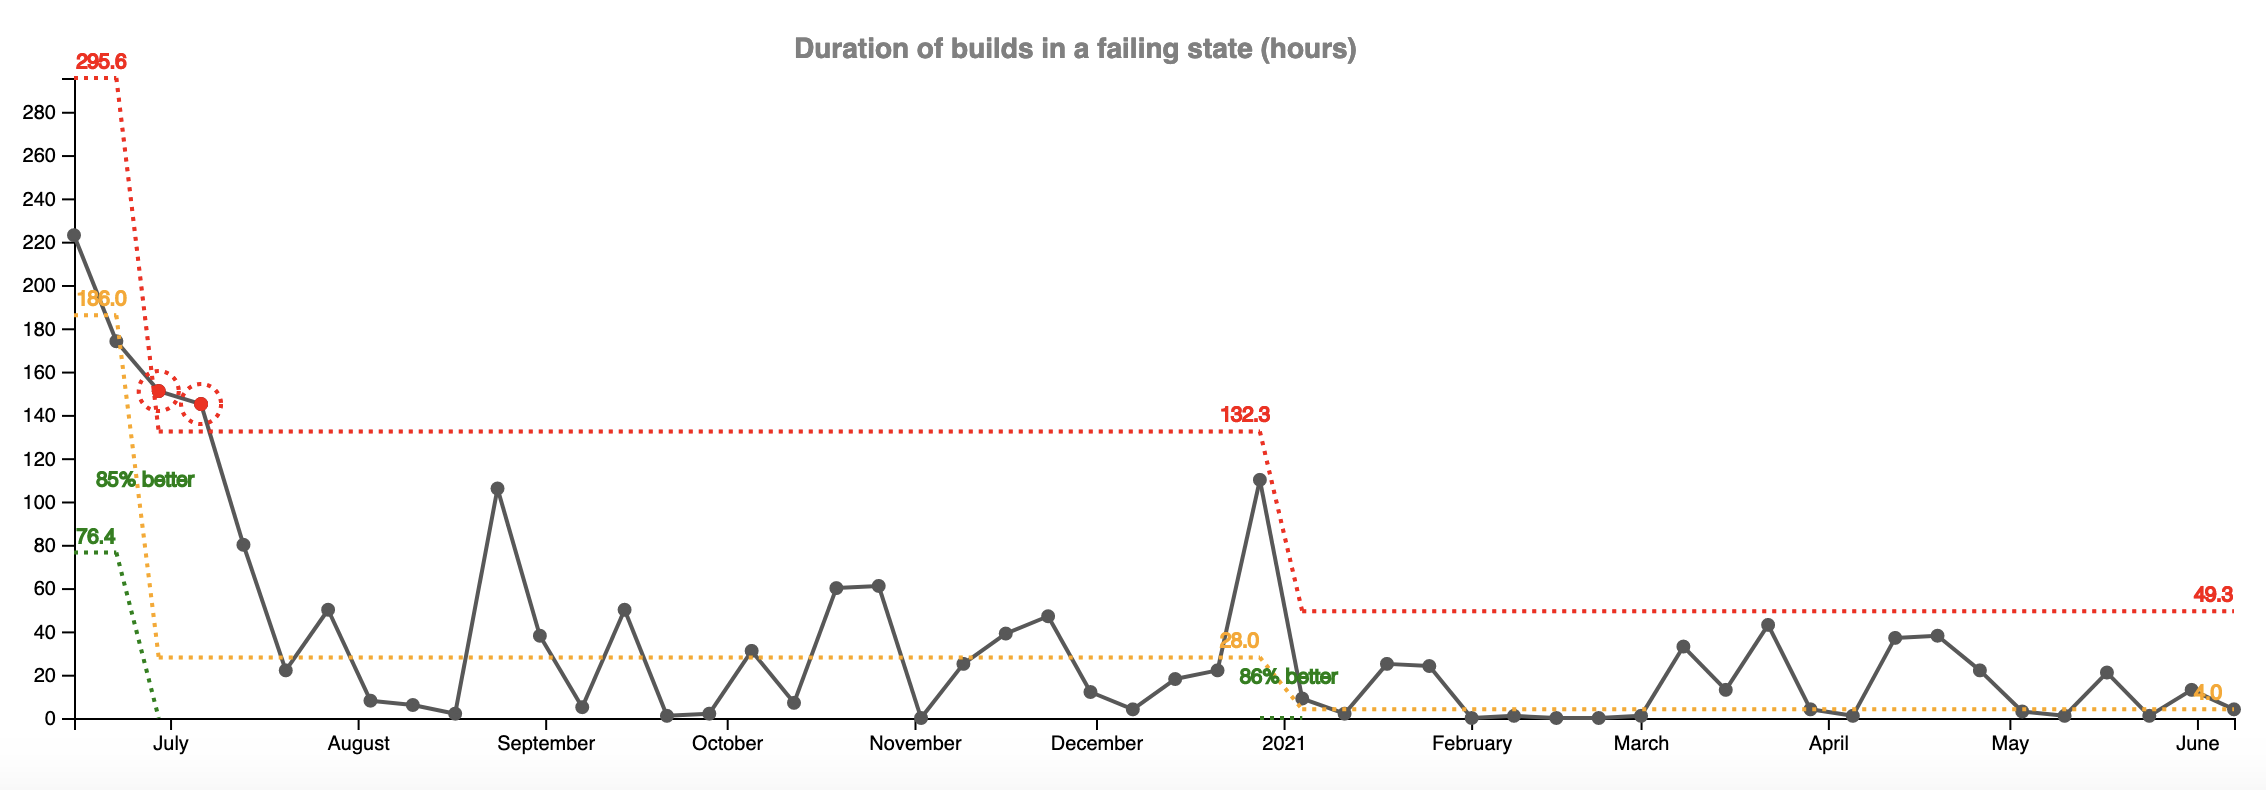
In June 2020, this team had 186 hours of BFD weekly (this team owns 29 builds). One year later - in June 2021, the same team had 4 hours of BFD per week. What's more - this has actually been ongoing since the beginning of the year as you can see from the graph (86% drop in January). This a whooping 46x times improvement.
But not everything is peachy in Falcon.io land. For contrast, take a look at this graph. It's from a different product team that owns 39 builds.
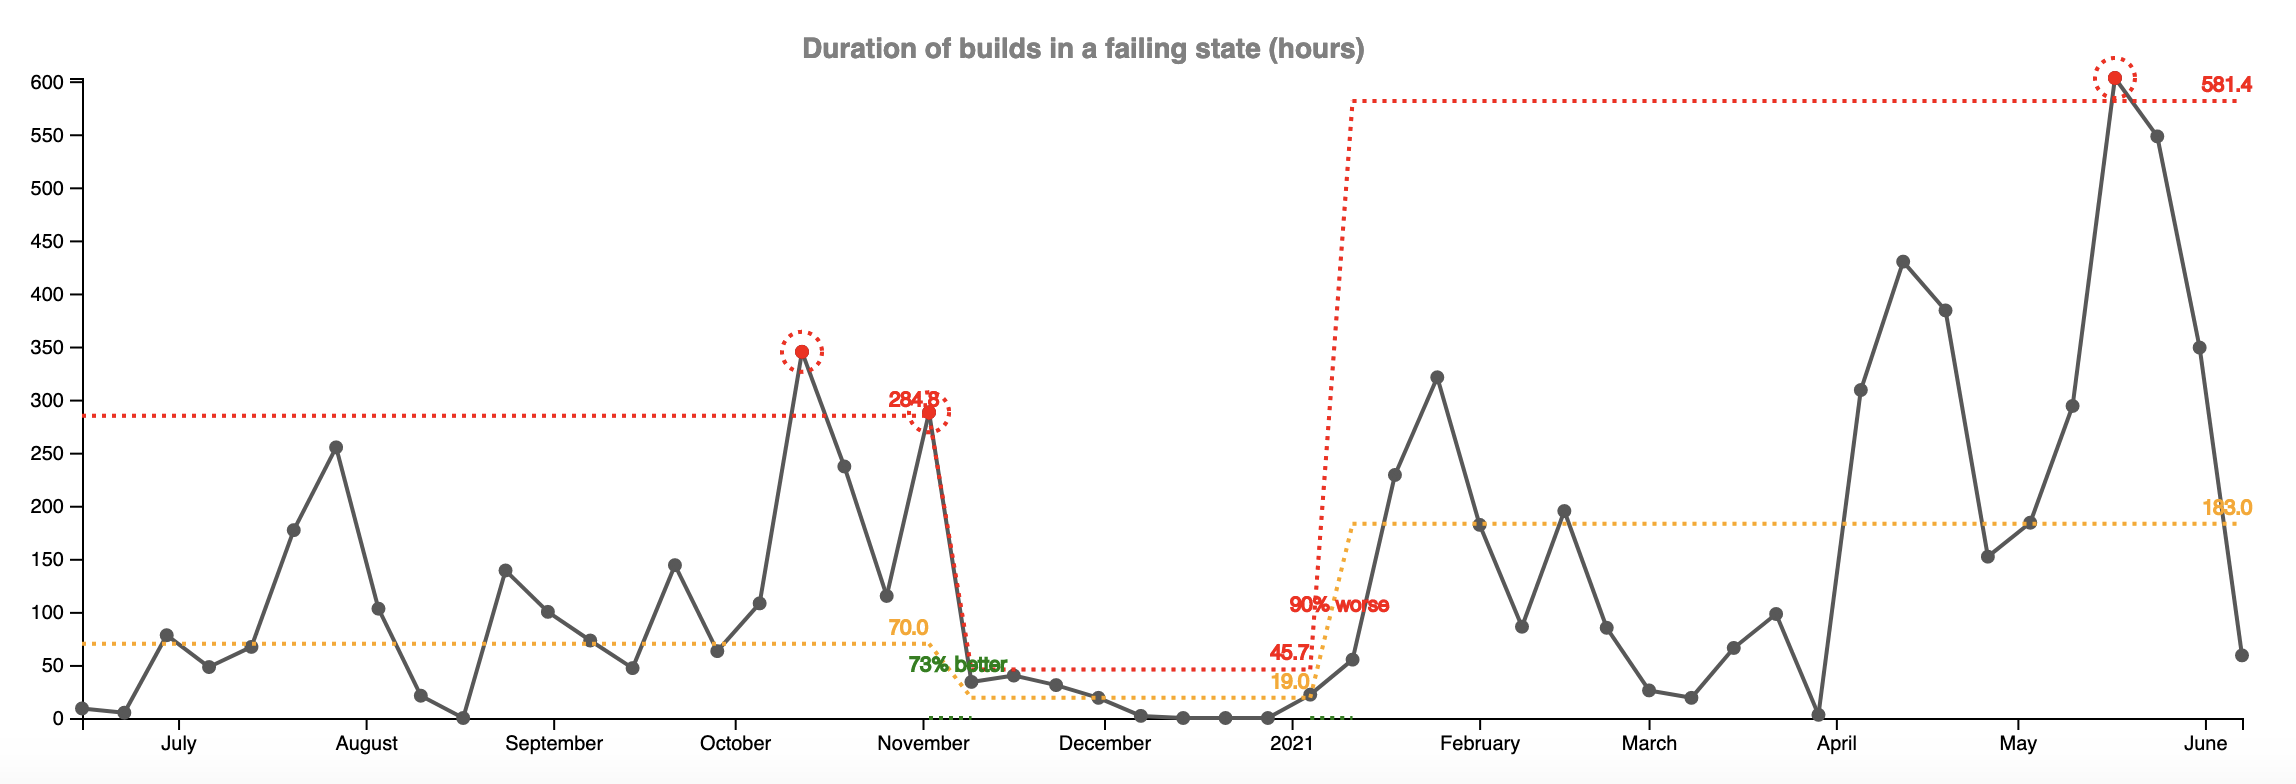
What stands out immediately is end of the year improvement. It's great with 19 hours of BFD, but then we're back where we were in 2020 and even worse with 183 hours of BFD per week since the beginning of 2021.
But a question remains - what caused end of 2020 improvement and more importantly can we sustain it throughout the 2021? Less commits, smaller changes size, only minor fixes. Whatever it is, we don't see such drop at the end of the year for any of the other teams, so it must be team specific and not company specific.
The last example is from a third team (owns 41 builds). Looks like they had their bad period of BFD in Nov - Mar period with 301 hours on average per week. Worst was the first week of 2021 with 500+ hours of BFD (everyone still in party mode?).
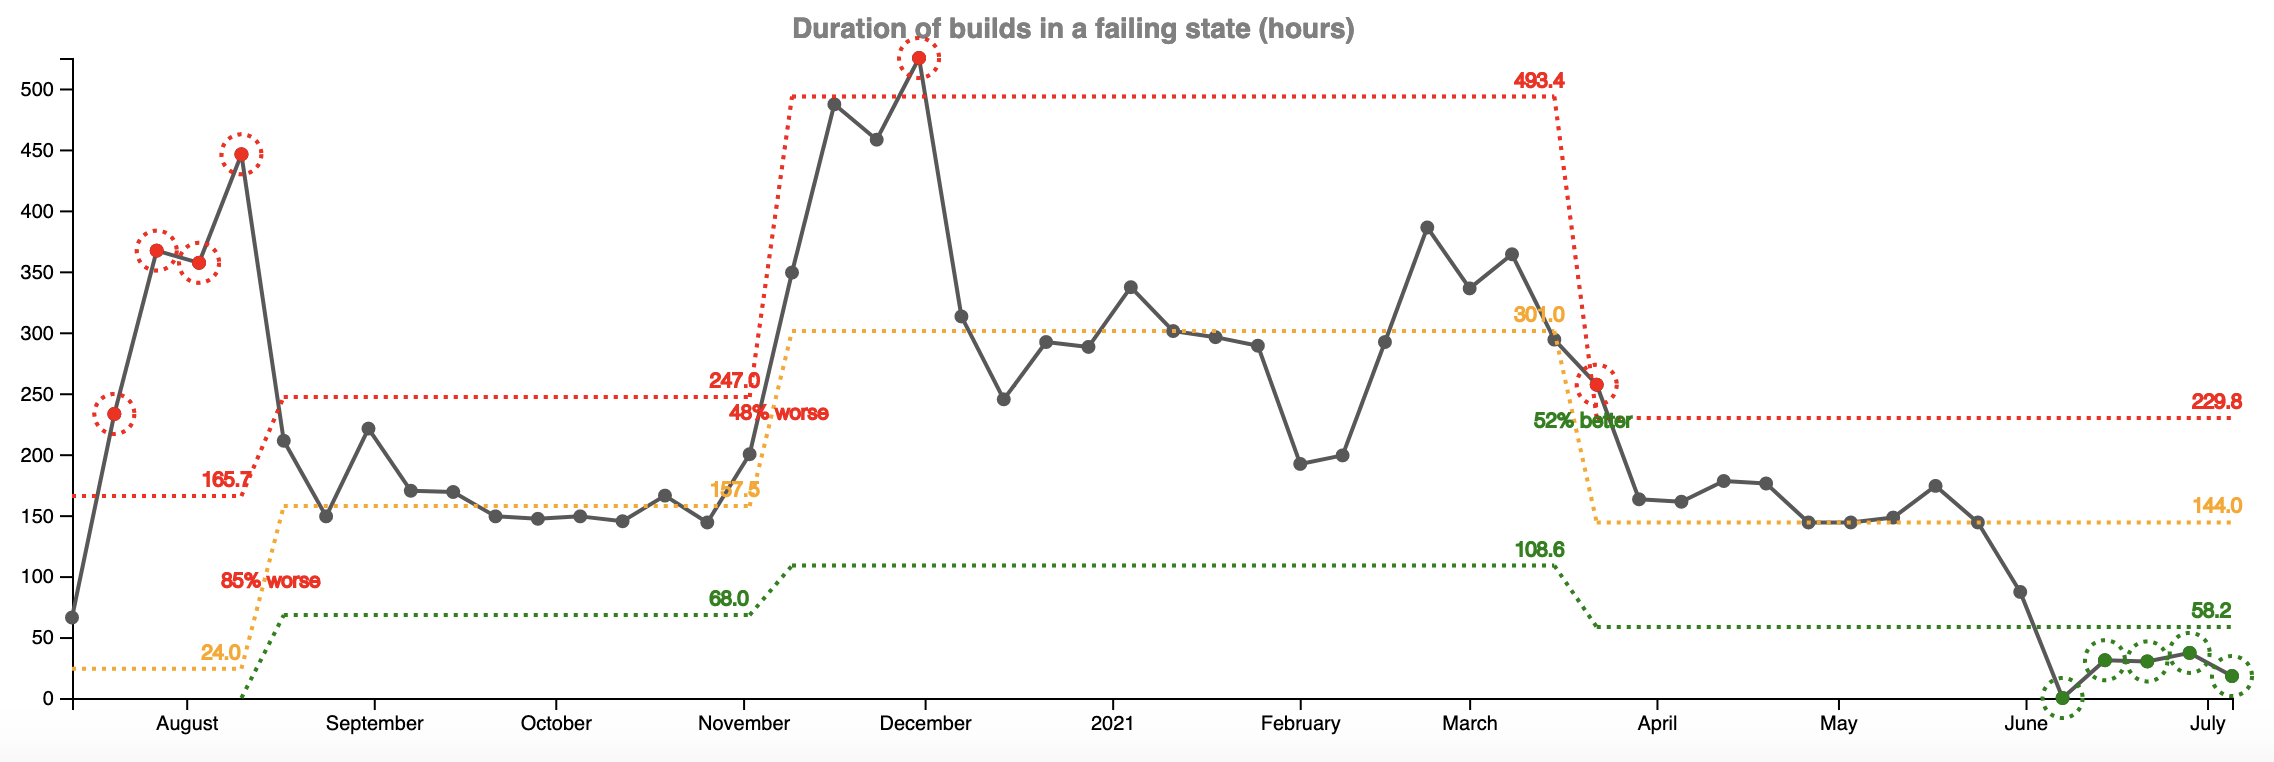
As you can see this team was down to 24 hours of BFD in August 2020. Then something went wrong.
In the last weeks of June/July of 2021 it looks the situation is improving. We need to have at least 8 consecutive weeks bellow the average BFD now (144 hours) to be able to calculate the exact improvement. And for that we have to wait for two more weeks.
Normalization
As you probably noted, the three teams above are responsible for different number of builds. If for some reason, we want to compare their BFD we need to divide the hours by the number of builds. In this case the BFD formula becomes:
BFD = (the duration of all the broken builds)/# of builds [hours per build]
| Team | Hours of failed builds | # of builds | BFD (hours per build) |
|---|---|---|---|
| A | 4 | 29 | 0,14 |
| B | 183 | 39 | 4,69 |
| C | 144 | 41 | 3,51 |