Deep Oracles: Multiplying the Value of Automated Tests

(This blog post is expanding on a presentation I gave recenntly. Slides are here)
Modern software is a complex beast. We need to be sure that even after the smallest change is introduced, our application continues to function as intended (also small does not equal safe). This type of testing is called regression testing. 15 years ago, when I started working as a tester, the regression tests were performed by hand. I was part of a testing team, sitting in crammed room with one small window, getting paid $160/month after taxes to do just that. Performing the same boring, mindless, repetitive regression tests before each software release. Everyone in the team was thrilled when got the chance to test a brand new feature (exploratory testing). Unfortunately the majority of the work was regression testing.
Performing manual regression testing works up to a certain point. As more features are completed, more tests move from the ‘exploratory’ type to ‘regression’ type. Like a Ponzi scheme, in order to continue operating, you need to hire lots of testers for cheap. At some point either the market drives up the wages, or the regression tests become way to many to manage effectively.
This is the point at which automated regression tests start to make sense.[1] They are great because they do exactly what they are programmed to do — no more, and no less. They don’t get tired, they don’t need sleep, they don’t get distracted, they don’t get nervous. In one word they are consistent. Companies can now hire less testers to do manual regression testing.[2]
Automated regression tests can be divided to two types depending on what level they operate in the application stack. Low level, small tests operate on code level — unit tests. High level, larger tests operate on the external interfaces of the application — usually an API or UI level. They also require the full deployment of the application. In this blog post I’ll focus on the high level tests.
There are three basic problems with high level tests[3] — they are slow, they are flaky[4] and when they fail it is usually hard to locate where the problem is. I’ve given a number of presentations about how the problems can be addressed.
In this post I want to highlight one more problem with the automated regression tests. Their rigidness, their inability to spot problems that they were not programmed to spot, their inability to detect the unanticipated.
A couple of years ago was presenting at a well known software testing conference on the East coast. I was very surprised that the talking point form the previous paragraph was brought by the majority of speakers as a way completely denounce automated tests. Their main idea was that we went too far with the automated tests and we should go back to manual testing. The investment in test automation is just not worth it and that it will never be able to replace a smart human.
I think we’re a long way from replacing humans in any creative and problem solving activity, but I want to highlight how we can make our tools smarter in order to augment our abilities.
The following are six simple approaches we use to expand the reach and multiply the value of our automates tests to be able to detect defects that they are not specifically programmed to detect. The best part of them is that no change to the test itself is needed and they can work with every programming language and testing framework.
Flaky Tests
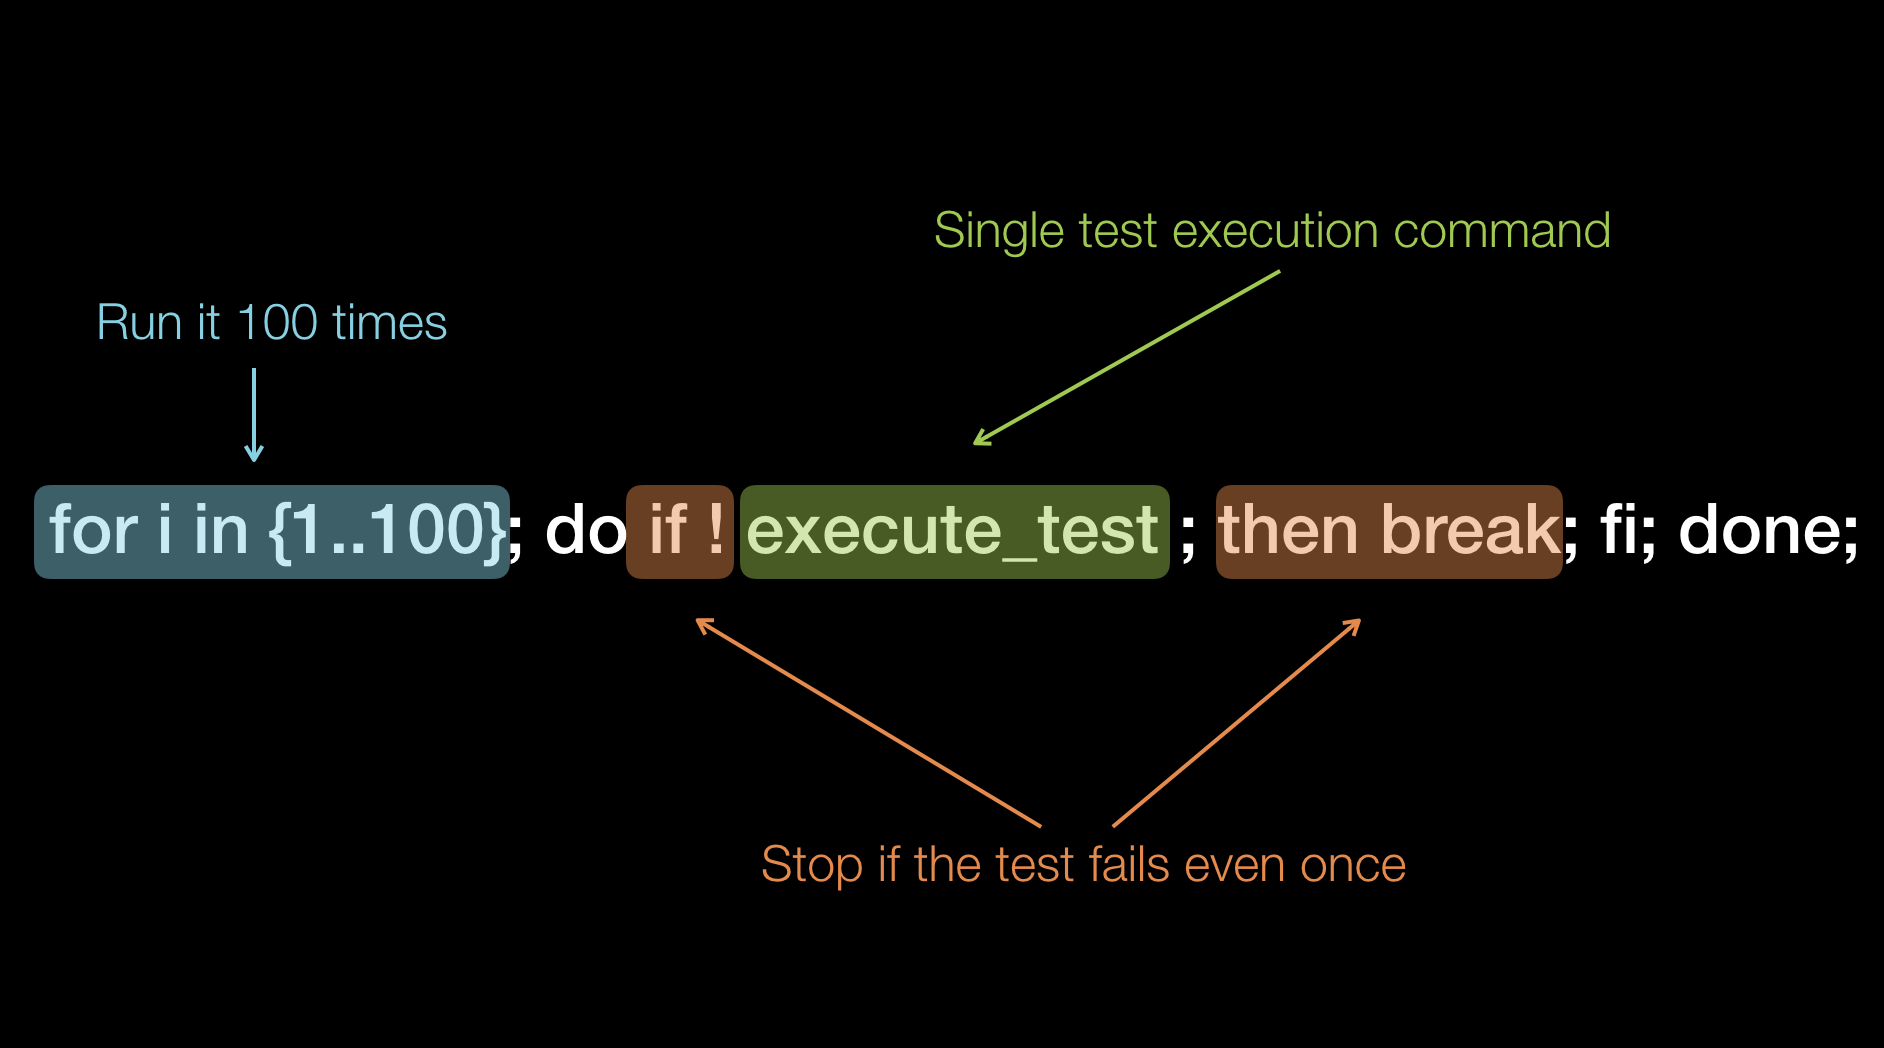
Lets start with something simple. Flaky tests are a reality for everyone who writes functional high level automated tests. Flaky tests are caused by three major factors: the tests themselves, how to application is setup to run or the application itself. How can you find if a single test is flaky? You can, for example, you can run it 100 times against an application that does not change (deployed on dedicated testing environment). If the tests passes 100 times in a row, then it has less than 1% chance to be flaky[5].
To speed up test execution, the functional tests are usually run in parallel, which puts additional strain on the application under test.
In my experience, the majority of the flaky tests are caused by the tests themselves (around 80%). But in order to gain more knowledge about an application we need to also pay attention to the flaky tests that are caused by the setup of the application and by the application itself (around 20%).
If you are sure that the test itself is not the cause of the flakiness, then it means that it’s the application. Don’t despair as this is an excellent opportunity to learn more about it and to improve. The following are some of the problems that we have discovered when investigting flaky tests.
Setup causes
- Load balancer or pool issues. Tests may fail when the load balancer points all the requests to a few backend machine (because of resource constrains). Tests will fail if a machine from the pool is malfunctioning
- Write concerns. Hardcoded read from a machine in replication that is not geographically the closest (fastest one)
- External Resources fail to load on time. CDN fail to retrieve a JavaScript library
- DB connection pools set to lower capacity
Application Causes
- Thread unsafe code.
- DB transaction locking takes too long
- Lack of or insufficient retries when problem occurs a distributed application.
- DB connections are not closed when write operation completes
Random Test Data
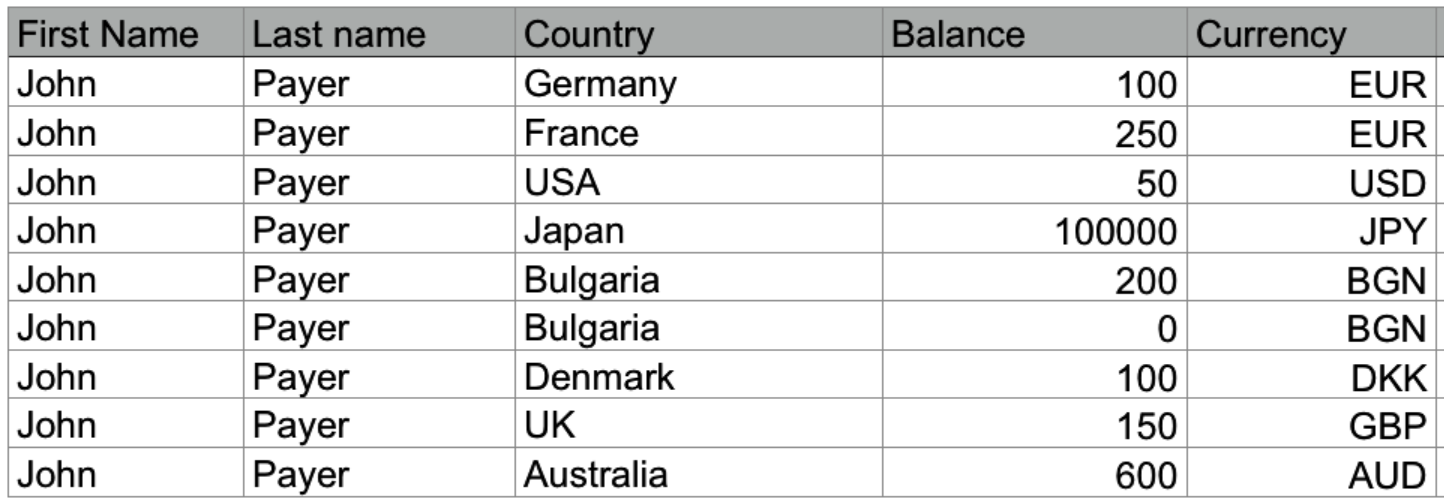
I used to work for a company that had a great set of automated UI tests. They were around 800. Before the start of each test, it was creating all the data it needed — users, clients, transactions etc[6]. And then the actual test would commence. The tests were reading test data from an XLS file. One row - one test case. The problem was that the data was always the same. Each user had the same first and last name. It was always - John Payer.[7]
Using random test data generation instead of static test data goes a long way. Instead Payer as last name why not iterate through different names? How about the famous O’Conner case (single quote in a name, used to find problematic SQL queries)? Or someone named Müller (ISO/IEC 646 character), or Славов (Cyrillic UTF-8 characters). Instead of having separate tests for each of the supported encodings, a better approach is to have the names automatically generated from a library. This test data generation function will be used by all existing tests at no extra cost. Such libraries are widely available for all programming languages. We’re using one for JavaScript and another for Ruby.
The company I currently work for develops SaaS that collects data from the biggest social networks (Facebook, Twitter, Instagram, YouTube, Linkedin). To Facebook alone, we currently send more than 10 million API requests for a day. In order for our tests to be stable and reliable, we developer a second generation HTTPS traffic simulator. Initially, the simulator would return the same post text when we tried to simulate new Facebook activity: ‘automated tests message’. As our clients started to discover bugs in the code related to parsing of the Facebook posts, we started using the ‘problematic’ posts in the traffic simulator.
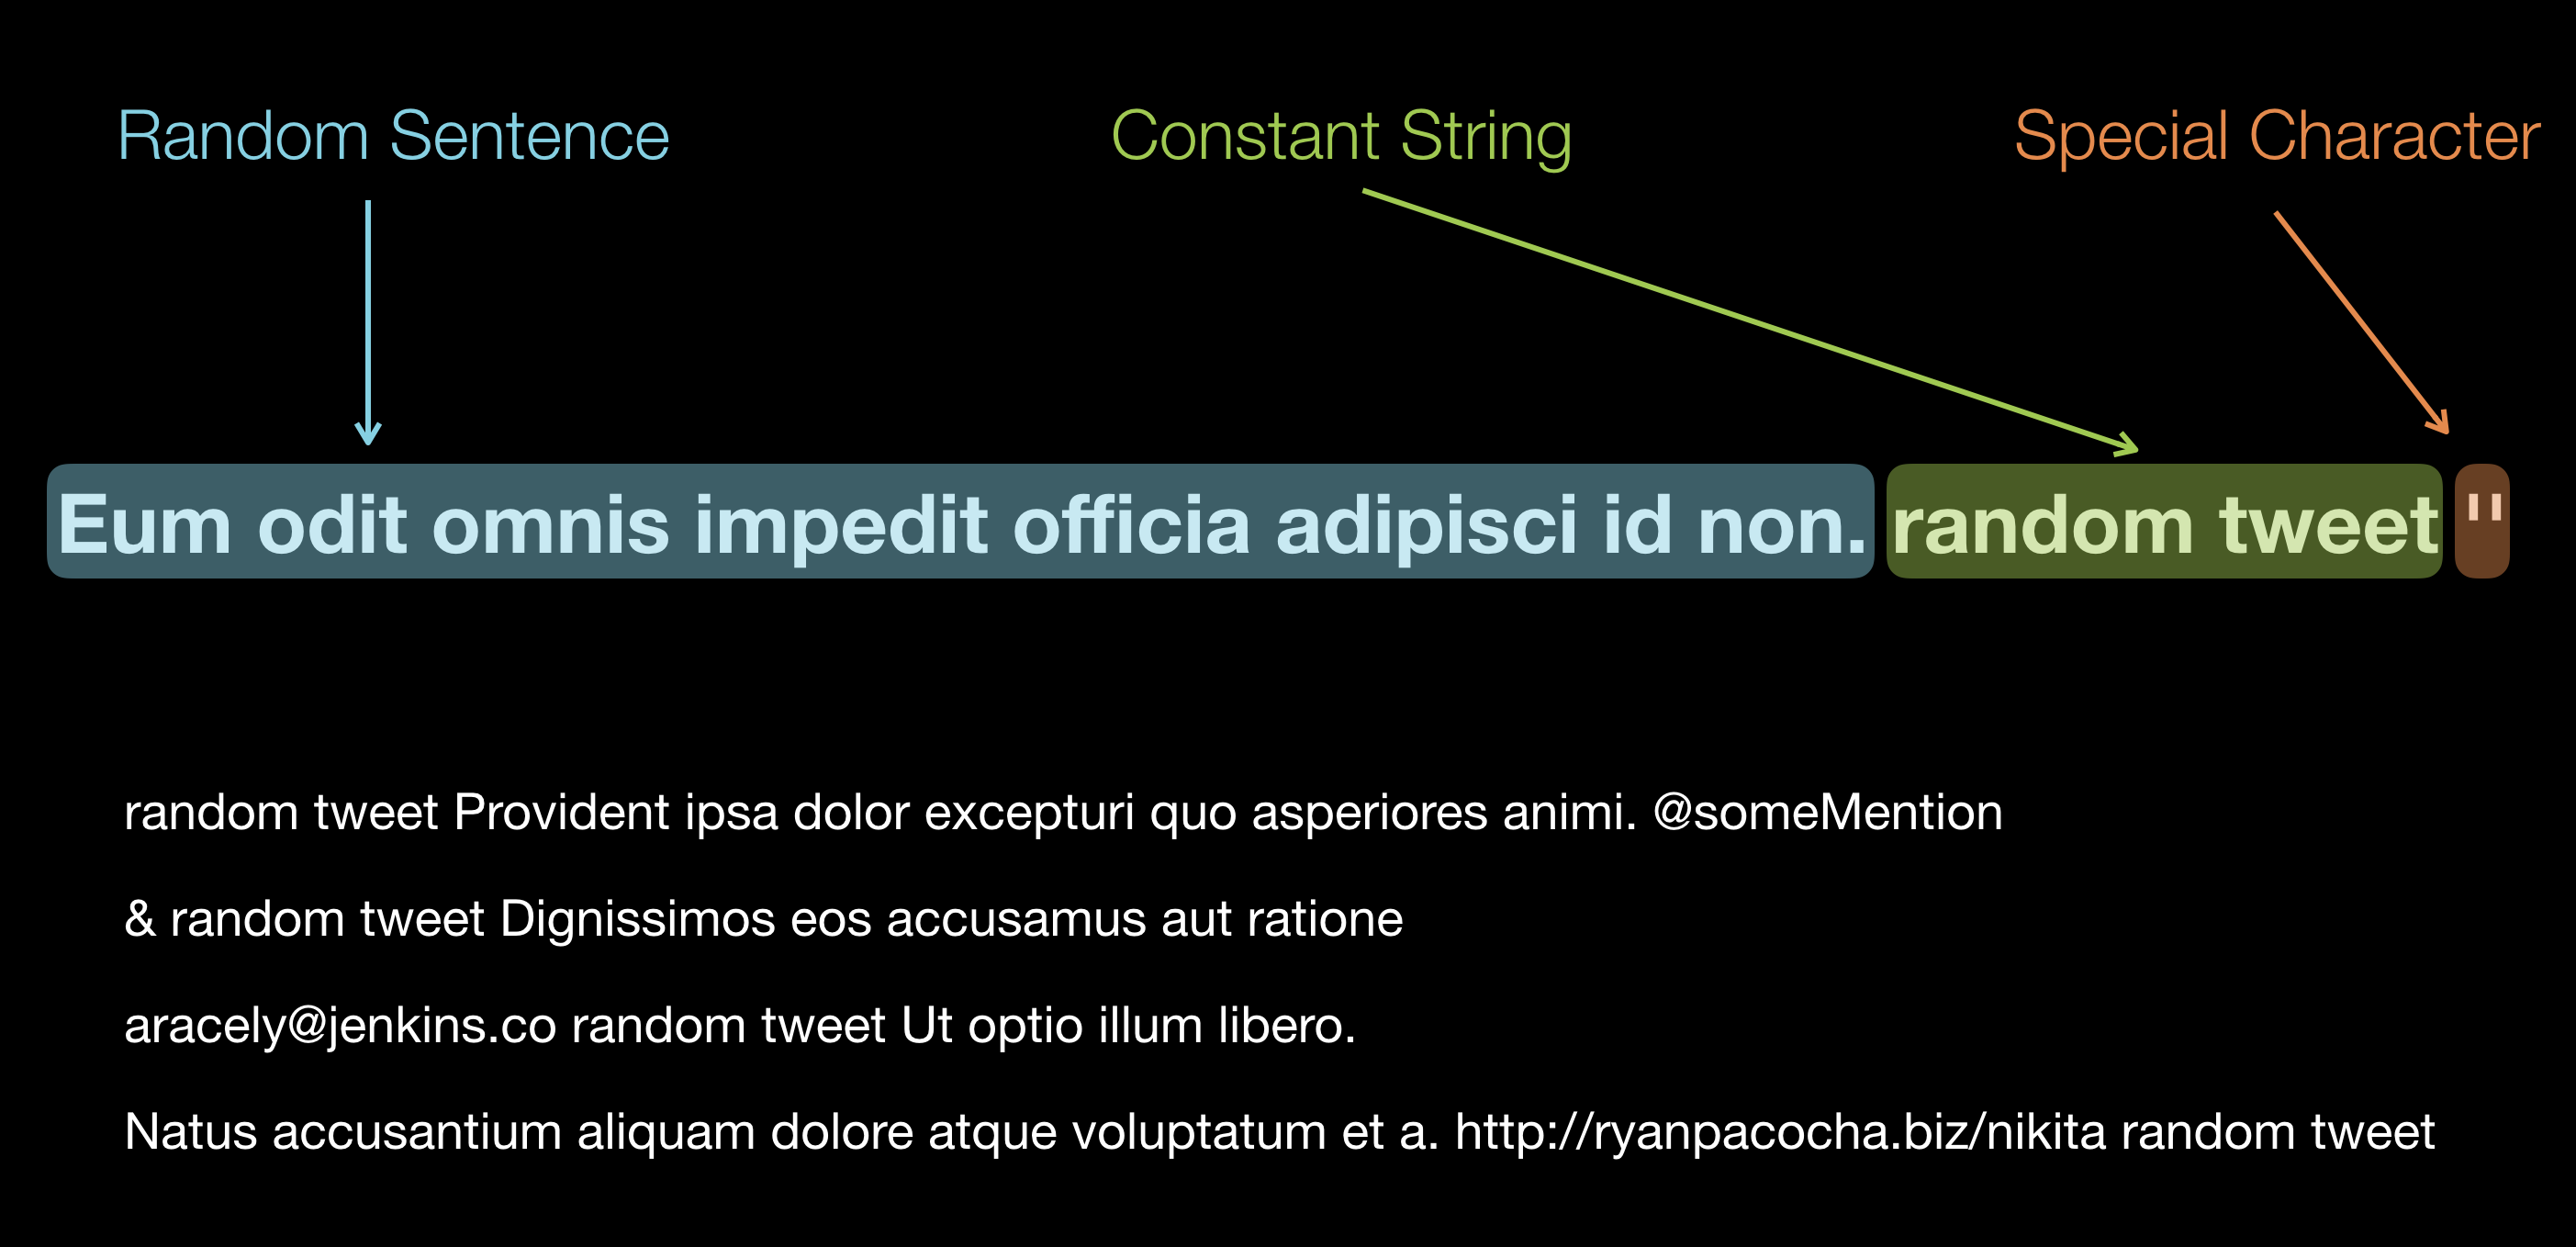
The three most problematic components of a Facebook post text for us were: special characters, non-ASCII encoded text, and mentions[8]. We constructed a simple function that returns a ‘random’ text containing any of those three characteristic in different order.
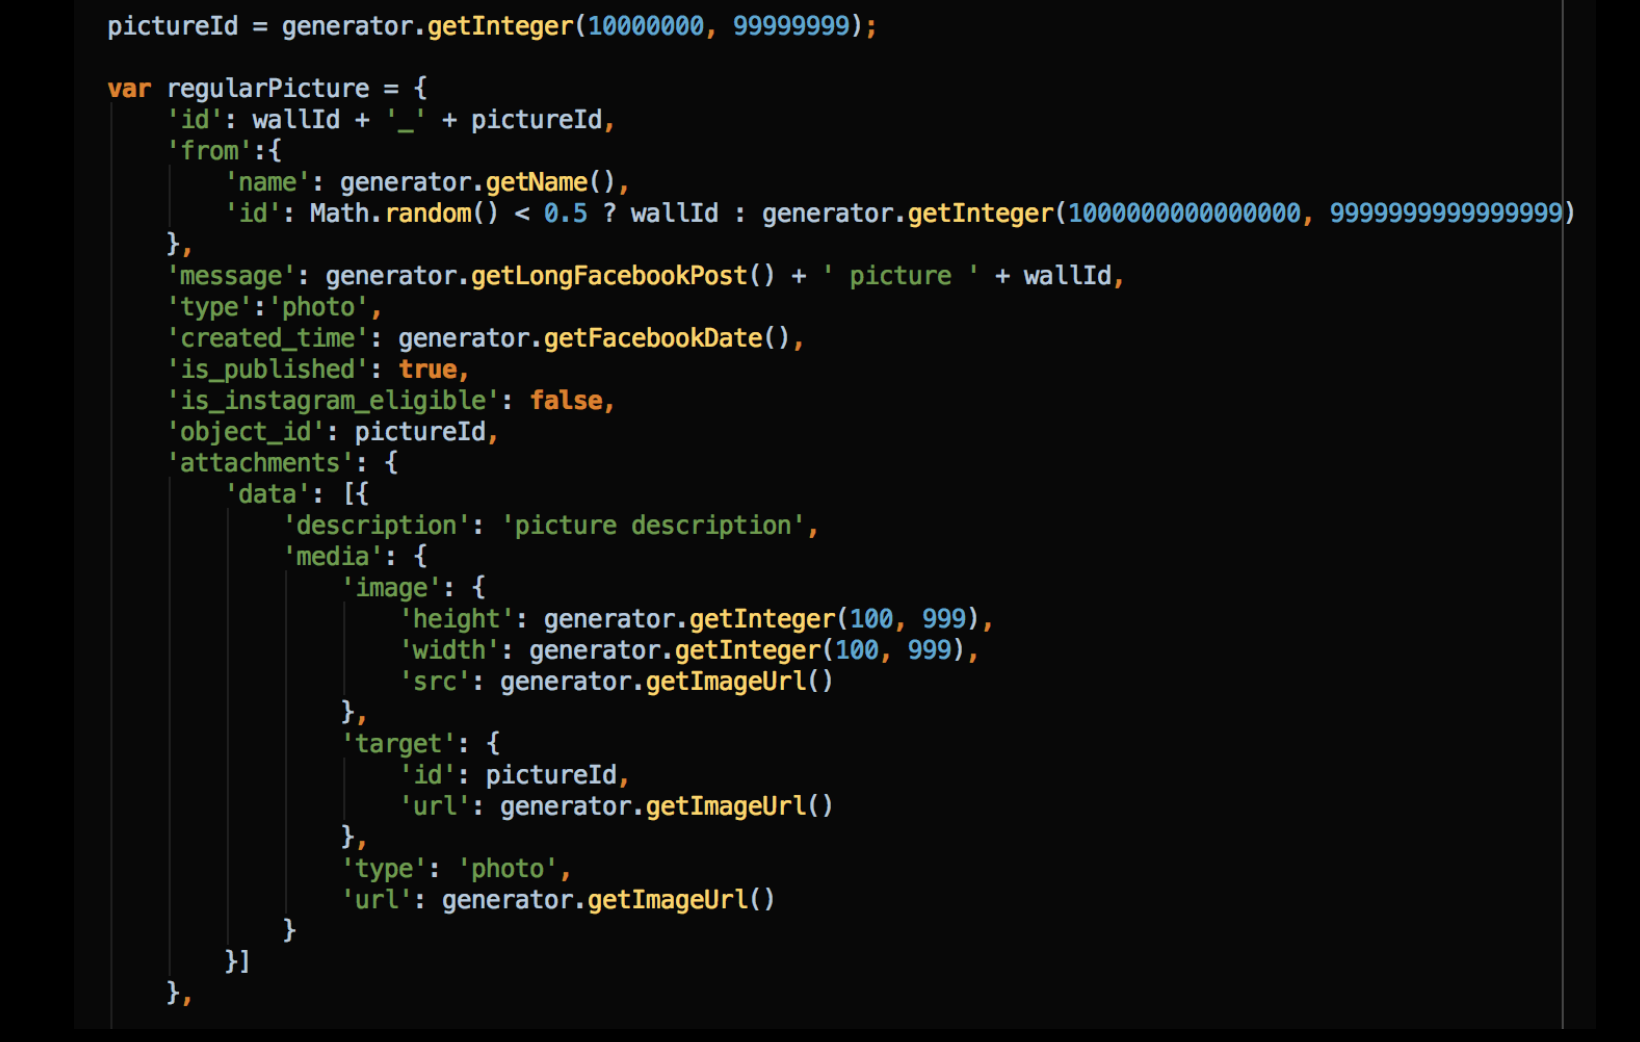
Here is another example of the random data returned by the simulator. This is how the data is generated when a request to Facebook is being made to retrieve a picture post. More real life examples can be found here.
Having an automated test that generates all the data it needs is by itself a great leap forward. Go one step further: randomize the test data and you will multiply the value of that test.
Attack Proxy
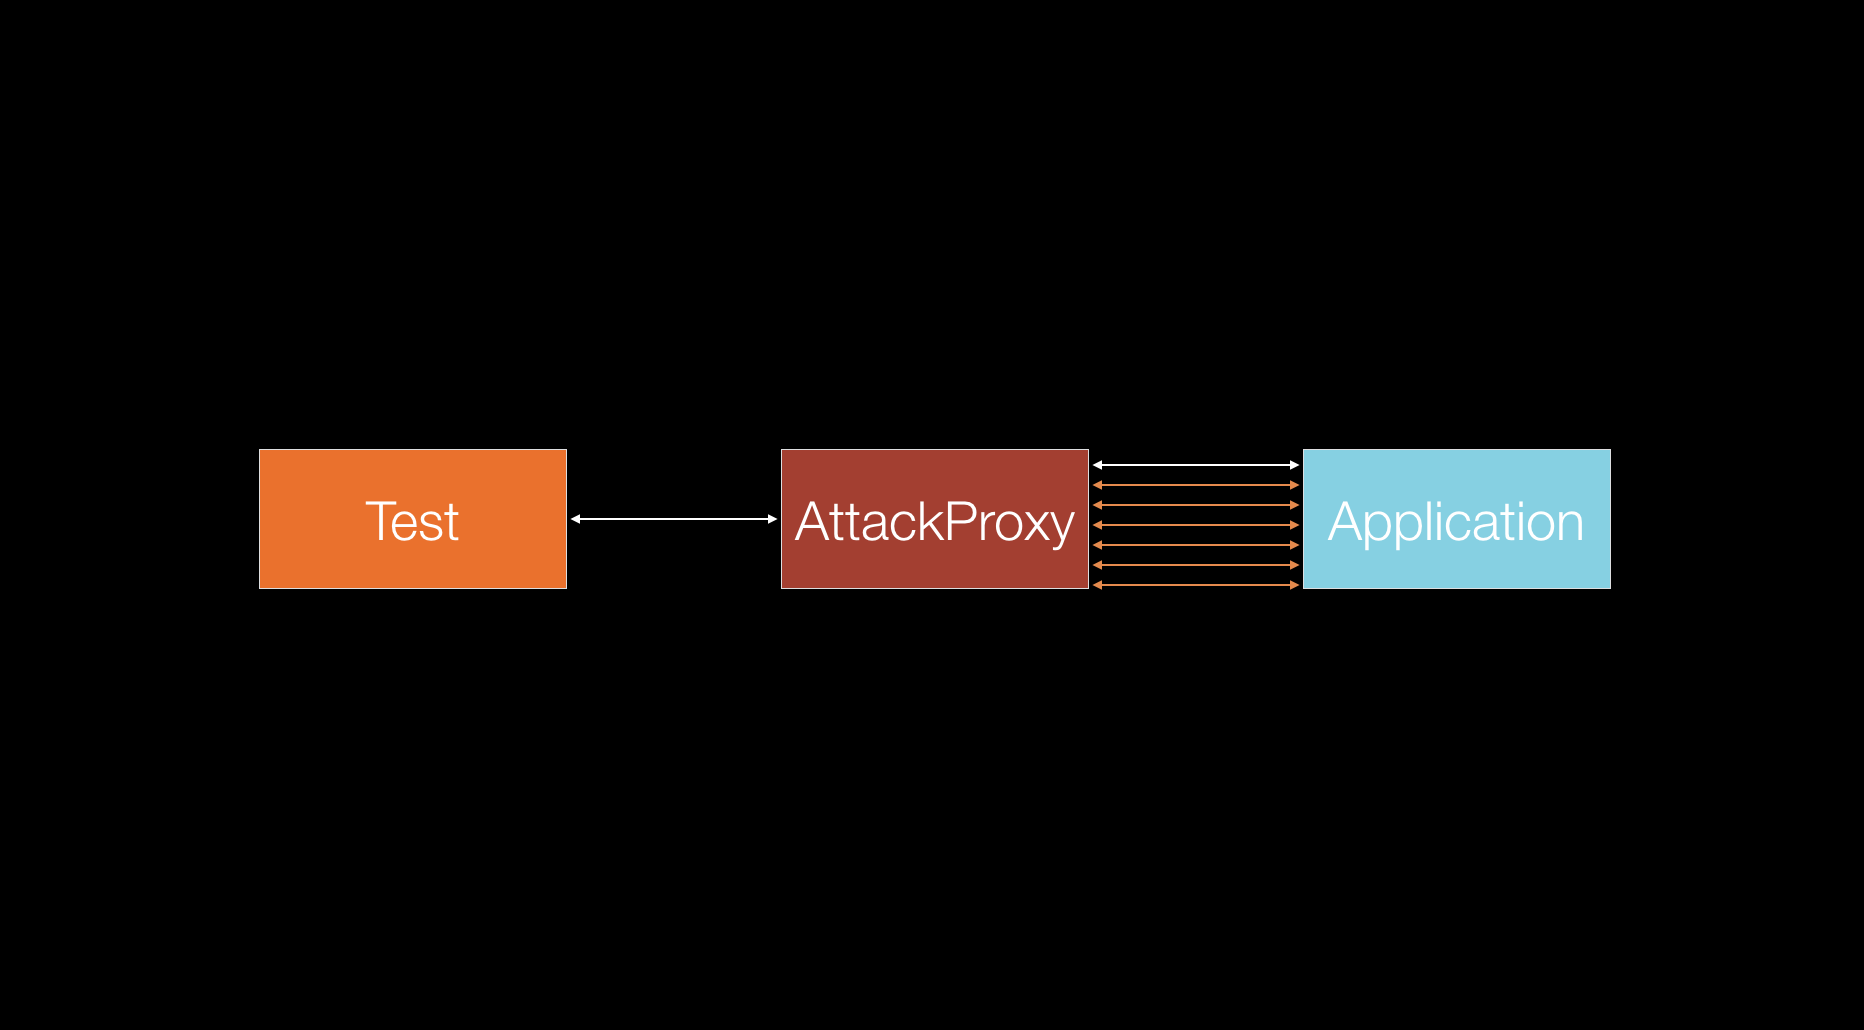
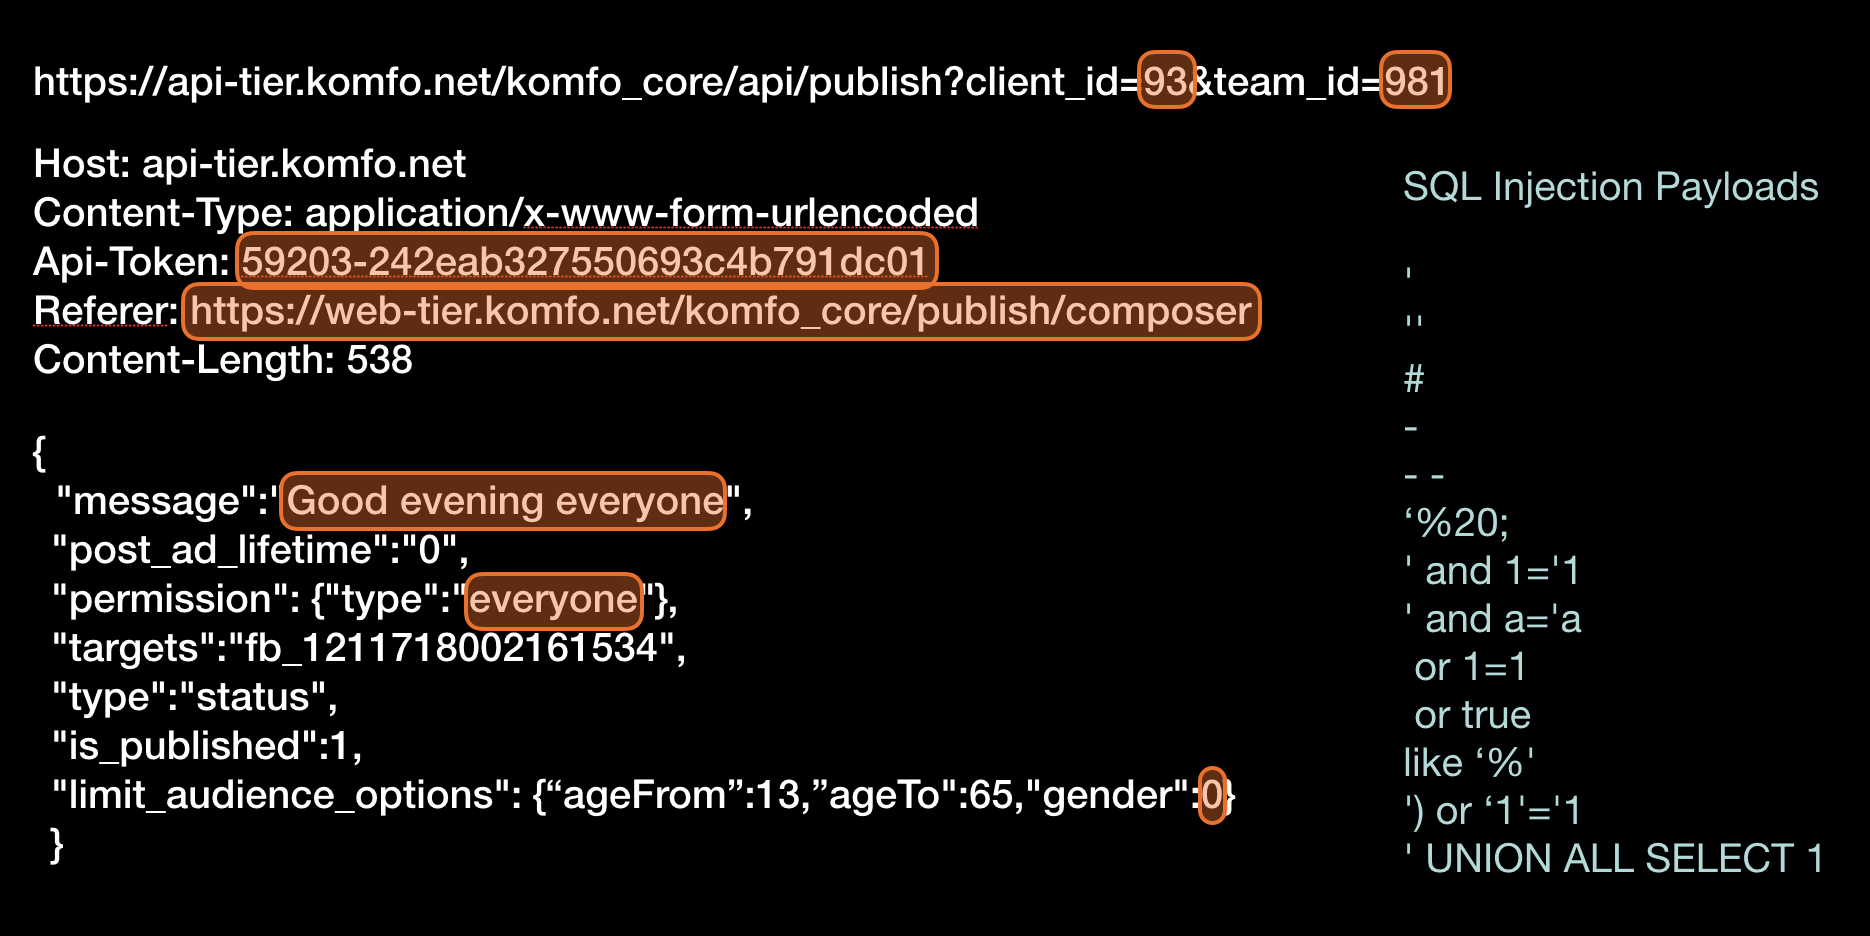
At present, the majority of the high level automated tests are using HTTP protocol to communicate with the application under tests. UI tests are using HTML/XHR sent over HTTP and web service tests are using JSON/XML sent over HTTP as well. As the HTTP protocol can easily be sent through a proxy server, a variety of tools exist to alter the HTTP traffic[9]. Those tools can be used to cycle through the input parameters of the HTTP requests in order to trigger security vulnerabilities in the tested application. Note that this technique is a subset of the previous one (a randomization of test data) — but with the sole purpose of finding a security vulnerability.
In the previous technique, we expect all of our tests to pass and investigate any failures. In this technique the majority of the tests will fail because we inject random data that will not be accepted by the application most of the time. What is valuable are the responses we get back. They are interpreted by the attack proxy and it decides if our application is vulnerable to certain attack.
Some of he major types of vulnerabilities that can be detected with this technique are: shell command injections, SQL injection, Cross Site Scripting (XSS), Cross Site Request Forgery, information disclosure.
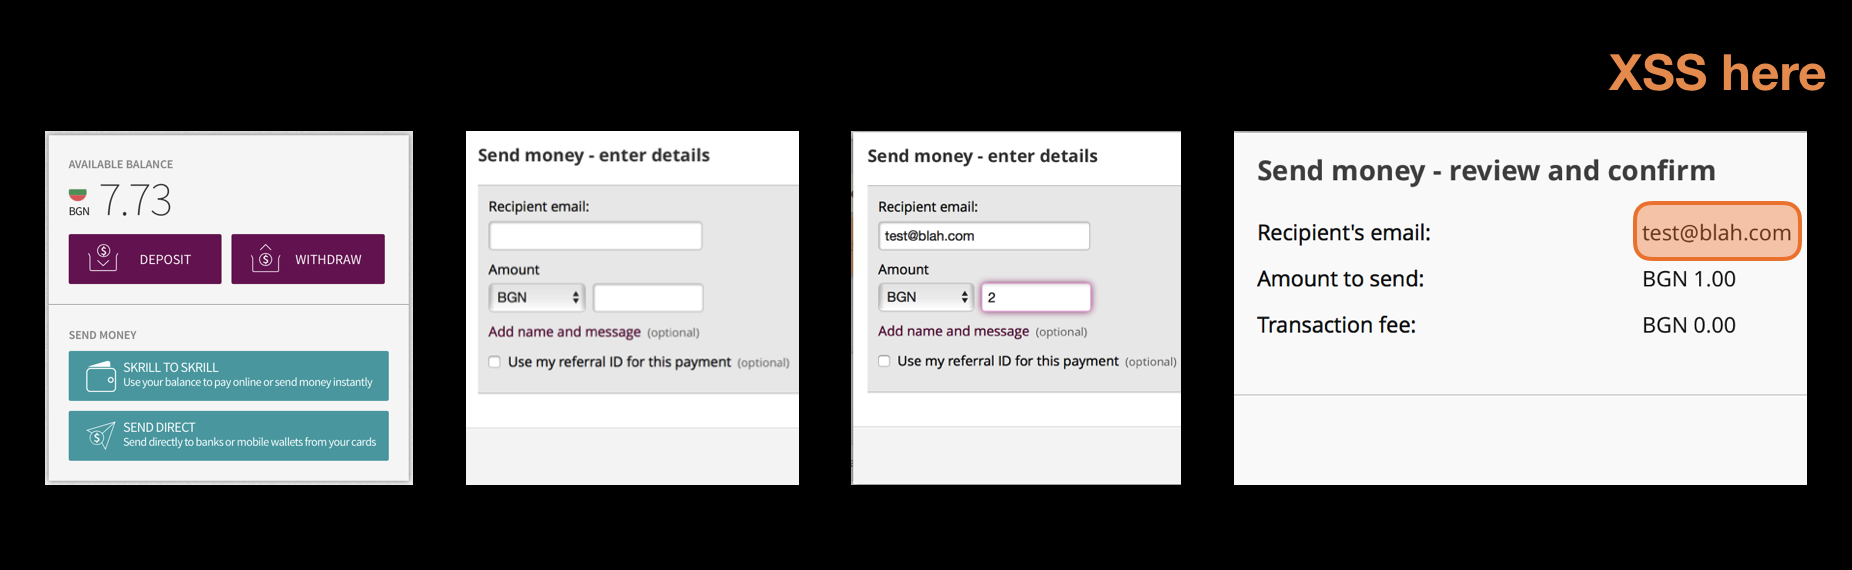
Having automated tests run through an attack proxy is way more effective at finding vulnerabilities than just pointing an attack tool at your SaaS application and expecting to crawl make request on its own. Your tests know how to login, how to navigate, how to insert the right data (e.g. a credit card number, or a valid customer identifier) in order to reach all the deep corners of your application. At a company that I worked for, we’ve uncovered pretty nasty XSS vulnerability three screens down, on the confirmation payments page. This page was never discovered by the automatic vulnerability detection tool because it did not know what values to enter to reach that deep. But automated UI test could. We found this vulnerability in the fist days that we passed all automated test though an attack proxy.
The attack proxy works by analyzing the incoming request and replacing a valid data in specific points with attack string. There are many attack scripts to trigger different vulnerabilities for one entry point. This means that the execution time of those tests will be longer. Depending on the tool you use and its setting, expect 3 to 7 times longer execution time. This fact makes automated tests using an attack proxy unsuitable to be run after every code change. If you cannot make them run faster (without cutting corners, limiting the number of checks performed etc.), the only sensible time to run them is during the night.
Some of the tools we’ve used are ZapProxy, Accunetix, Netsparker and Burp Suite. Of those three our favorite is the last one. One point to consider - if your high level tests run in headless mode (this is also valid for the UI tests), it’s better to choose a tool that works in command line only, without UI. Some of the attack proxies have only UI interface for setup which is really hard to work with if you want to automate the nightly headless run.
Dedicated Testing Environment
The next three techniques are possible only when the automated tests are running in their own, dedicated environment. If you don’t have that setup already, stop reading this blog post and come back when you have it. Using dedicated testing environment will also increase the stability and predictability of your automated tests.
Application Exceptions
An exception is thrown when an application does not know how to handle an unexpected condition. It means that we, as developers, have not anticipated certain action, event or condition. It means that we don’t (already) have enough understanding of the problem we’re trying to solve. As our applications are getting more and more complex, not being able to anticipate every outcome becomes the norm. What matters is now we react to those unexpected events.
Lets assume you have 700 automated tests that run on a dedicated test environment. You run them and they all pass — no failures. Case closed? It turns out that you can do a lot more even when your tests complete. If you reset your dedicated testing environment[10] to a clean state before every batch of tests starts, then those tests will leave their unique marks on the pristine testing environment.
It order to be useful, the automated tests have some sort of assertion, most likely in the last step[11]. They may check for a desired entry in a database or if specific response by a web service is there, or if a certain element in present in the UI. But those assertions count is quite small. A single test is programmed to check only for handful conditions that will certify that the tested functionality is functioning correctly. During the test execution, an exception may be thrown, but for various reasons it may not bubble to the interface the high level test is using (API to UI). Thus this exception will not cause the test to fail[12]. Sometimes the developers will catch an unexpected exception, log a message such as “Something Wrong Happened” or “You should never see this error” and continue the program execution as normal.
Even if your automated tests pass successfully you still have work to do. Check all the applications logs (the code that you’ve written) and the all components logs (databases, message brokers, configuration services) for exceptions or errors. If there are none, then declare your test run as successfully completed. Any exception found means that something is wrong. In this case fail the test run and start investigating.
By default, PHP will log all it’s errors/exceptions in error.log file.
A Java application will most likely use whatever file is defined in log4j.xml file.
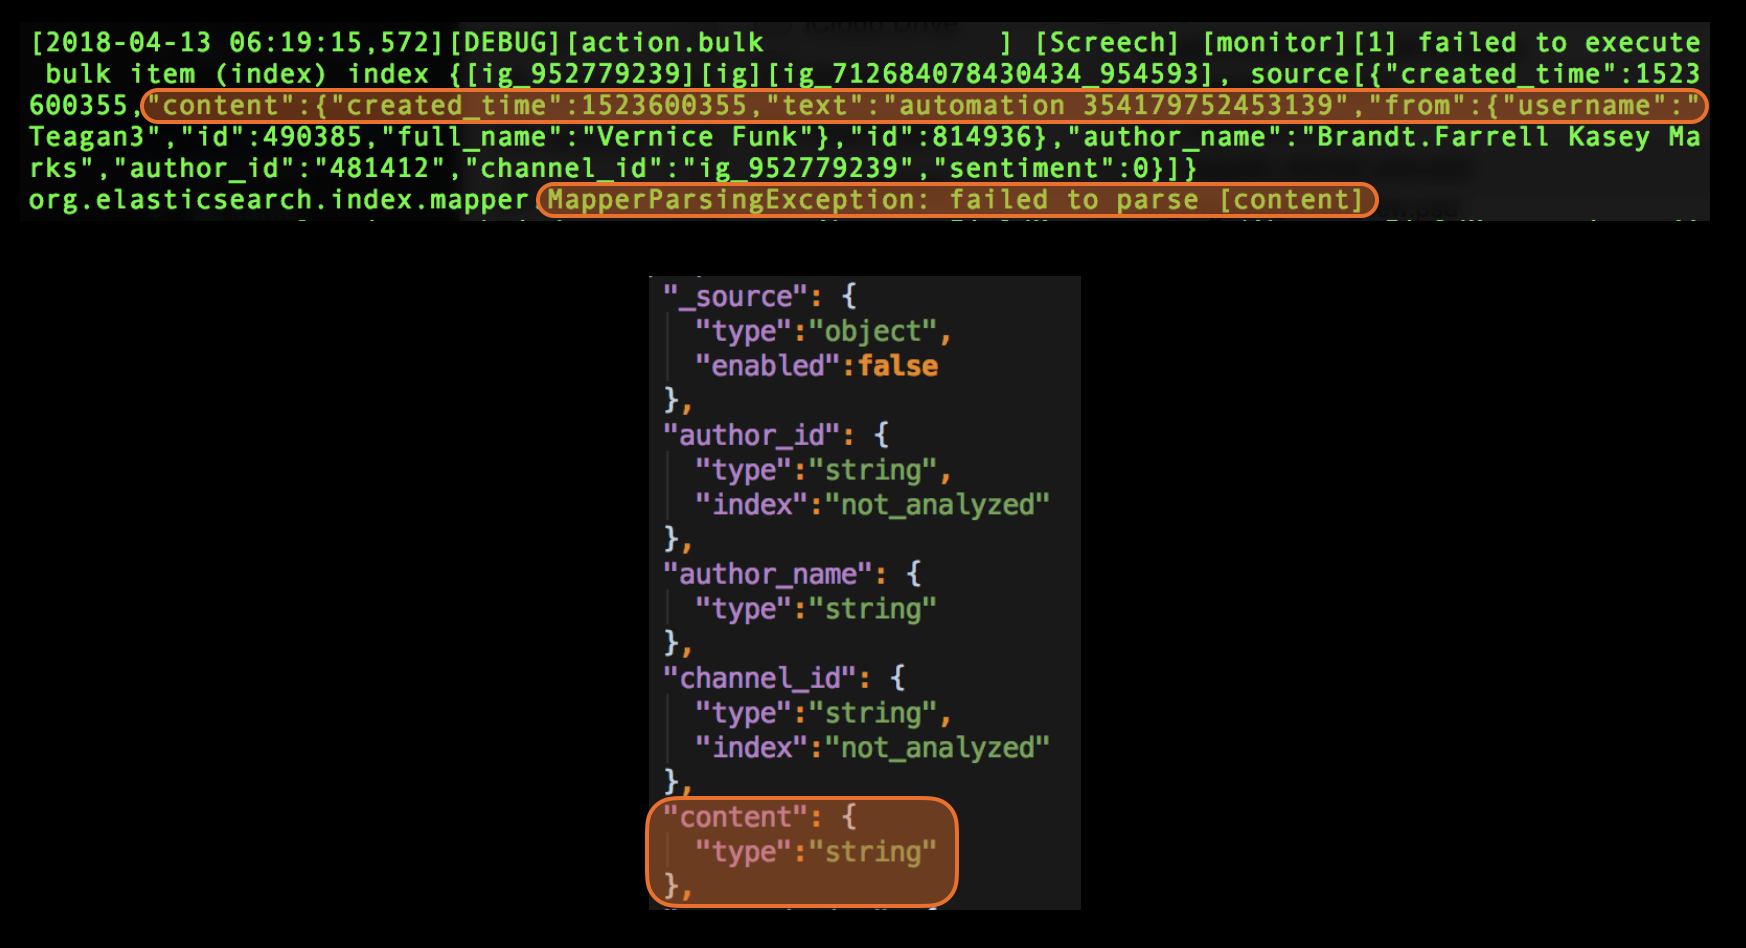
Here is an exception from elastic search log file that is due to change in the mapping configuration. The indexing was performed by an async task triggered indirectly by the automated test. It was fire and forget type of task so it never bothered checked if it succeeded. We caught this problem only because we were monitoring elastic search logs for exceptions.
How you search your logs files for exceptions depend on their format. In a text file a simple grep for the case insensitive string ‘exception’ might be enough. You may have to parse any JSON/XML log files and most certainly you’ll need to parse binary format log files.
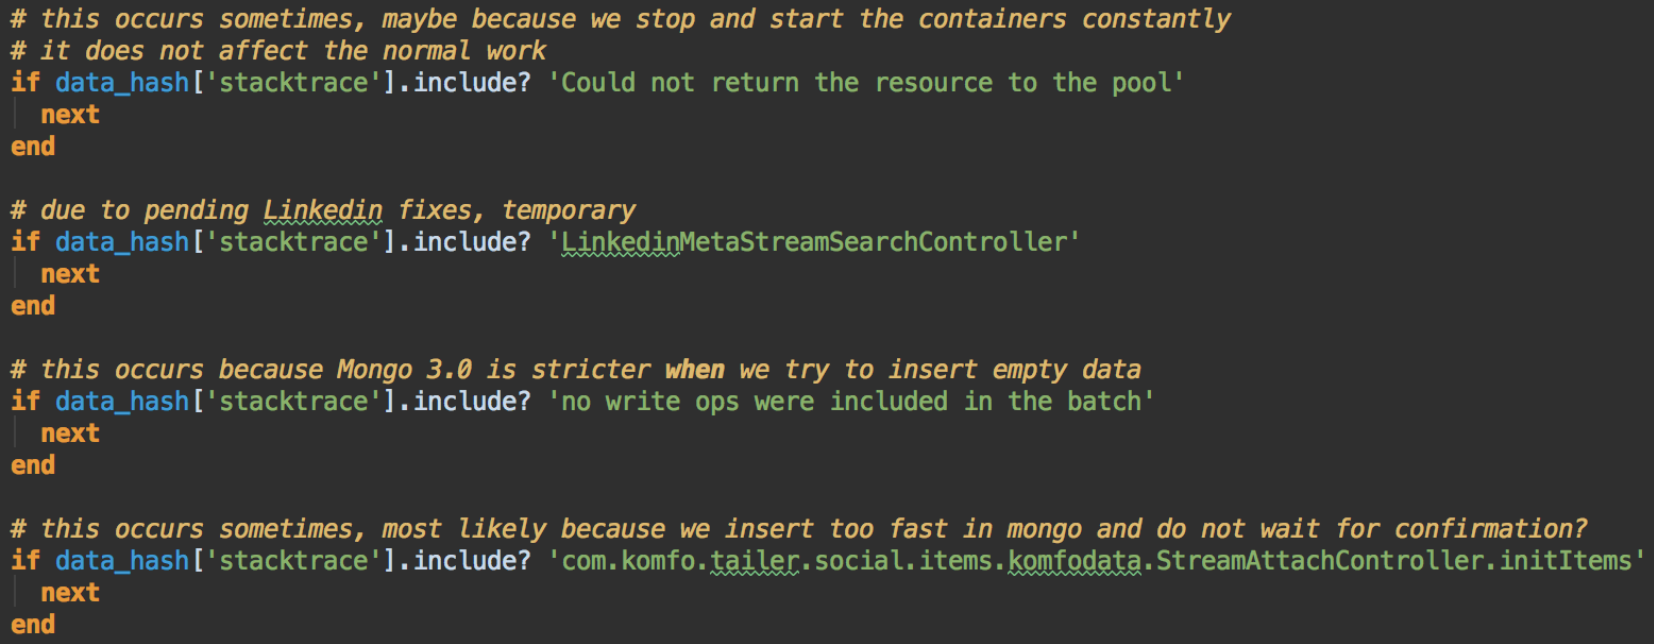
As you progress with the search for exceptions in your logs, you’ll find it useful to exclude certain exceptions — based on the type of exception, on the message or on the stack trace. Those exceptions may be expected, for example the developers throwing an exception when simple information logging would be enough. Or exceptions caused by factors outside of your control.
Sometimes it’s really useful to know which of your 700 tests that passed caused a specific exception. If you’re running your tests in parallel (to speed up execution) this is not a trivial task. One approach when you encounter an exception in the logs is to start running the tests sequentially. After each one completes, check the log files for the given exception. This type of automatic detection requires a bit of coding and it may look slow, but it will save you time. If you want to know which test causes and exception, you will most likely use the same technique but do it by hand.
Monitor your logs for exceptions after the tests are complete is a great way to extend their value beyond the simple, high level assertions in the last step.
Bad Data
An exception is a great manifestation of a condition that cannot be handled by the application. It shows exactly where the problem lies. Some error conditions are more subtle and do not reveal themselves that easily. Take for example bad/invalid data. It can take many forms, including: duplication, inconsistent format, missing, conflicting, inconsistent format, unsynchronized, unrealistic. It may not trigger an exception at first and it can be recorded and to go unnoticed for a long period. Problems start arise when this data is being used, but when this happens, the code that produced it may not even exist.
Some of the world’s most expensive defects are caused by handling bad data. One of the latest example is Mars Schiaparelli Lander. Around 3 kilometers above the surface of the planet, the internal sensors reported a negative altitude which was interpreted as successful landing. Because of this, the parachute was released, and the lander began a free fall. The bad data in this case was the negative altitude which is unrealistic.
Back to Earth, at our company we have our share of bad data. Every morning we’re reviewing the exceptions that happened in the last 24 hours in production. It turns out that 19% of them are caused by bad data. We had NoSQL collections that contain up to 5% invalid data.
One of the more glaring examples of bad data consequences caused an application in production to crash three times with out of memory errors until we figured what happened. We develop SaaS application that collects lots of data from the biggest social network. Twitter is among those networks. The account ids that we want to collect data for are stored in an SQL table. A Twitter account id is usually a large number.
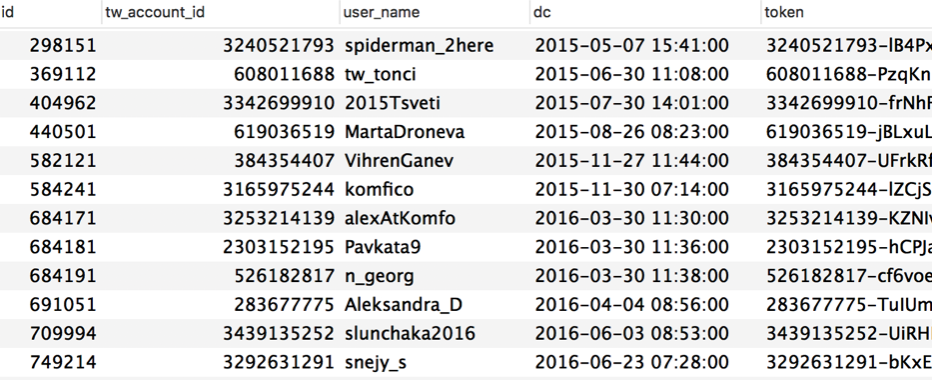
The backend at the time was written in PHP. There was a cronjob that run periodically, read the Twitter IDs from the SQL table and then sent API requests to Twitter. The job was written so that it could handle data collection for a single Twitter account, or for all of Twitter accounts if the single Twitter ID was not set.
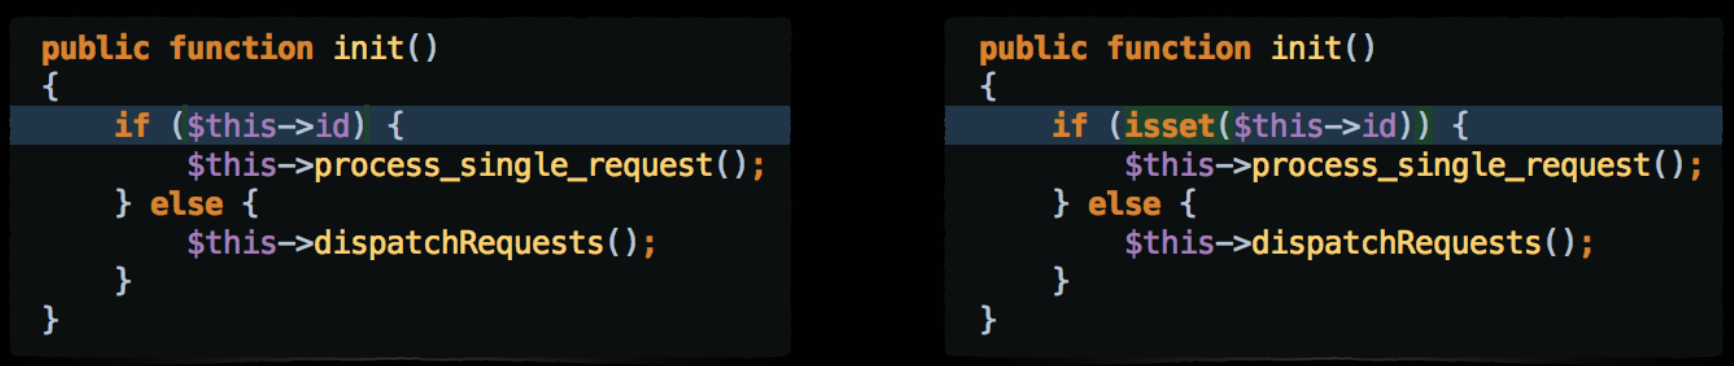
On the left side you can find the original code. At some point, unknown to us, a new row appeared in the Twitter Accounts table. it’s account ID was set to 0 (zero). When the cronjob was run, line 20 interpreted 0 as null[13], so the if condition was not satisfied. Instead of collecting information from Twitter for a single account only, the execution jumped to the else condition that was collecting data for all the Twitter accounts. When the loop circled back to that row with Twitter ID set to zero, it started once more the full data collection. There was no break from this infinite loop. All of the system memory was consumed and the application crashed. It had to happened three times until we finally figured out why.
The point is that 0 is a valid integer. SQL column type was ‘bigint’, so the db was not complaining upon row insert. And yet, given the context that we operated in (Twitter) this was bad data of the unrealistic type. Same as the negative attitude, it should not have happened.
What we developed was a piece of code to periodically check the database for bad data. To generate the list we brainstormed what bad data would look like for our context. We also used bad data that was causing exceptions in production
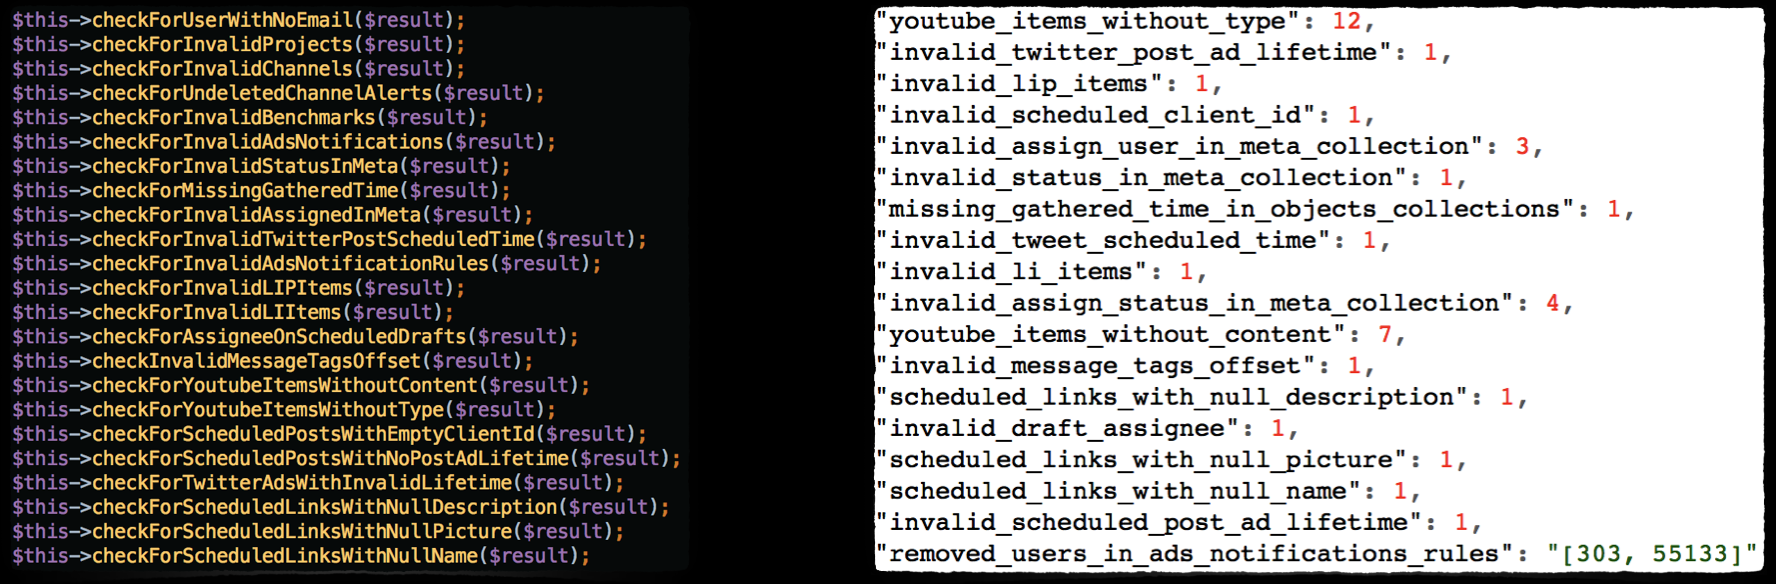
Whenever the high level tests pass successfully we run this same bad data check to make sure that the newly pushed application code is not generating any invalid data. The test suite fails if bad data is found.
Performance Metrics
Compared the previous two techniques this one is not binary. Most of the time, you cannot fail the build just because a metric reached a threshold. What is important is the trend over time. But let’s not get ahead of ourselves.
Besides checking for exceptions and bad data, after the test run you can do one more thing - take different metrics related the performance of an application. Since the test environment is isolated and used only by the automated tests, the results are very accurate. Here is an example of what you can measure during and after the test run completes.
Log file: size in bytes, number of lines, number of errors and exceptions, regular lines to exceptions ratio
Network: DNS requests, number of packets, calls to external 3rd party services
SQL server: the number of read/write queries, average transaction time, the number of threads, pool reads/requests, pool pages/utilization
NoSQL server: the number of read/write queries, total connections, network requests
JVM: objects created, threads, heap size, garbage collection
Server/Container OS: average/top CPU, memory consumption, swap size, disk i/o, network i/o
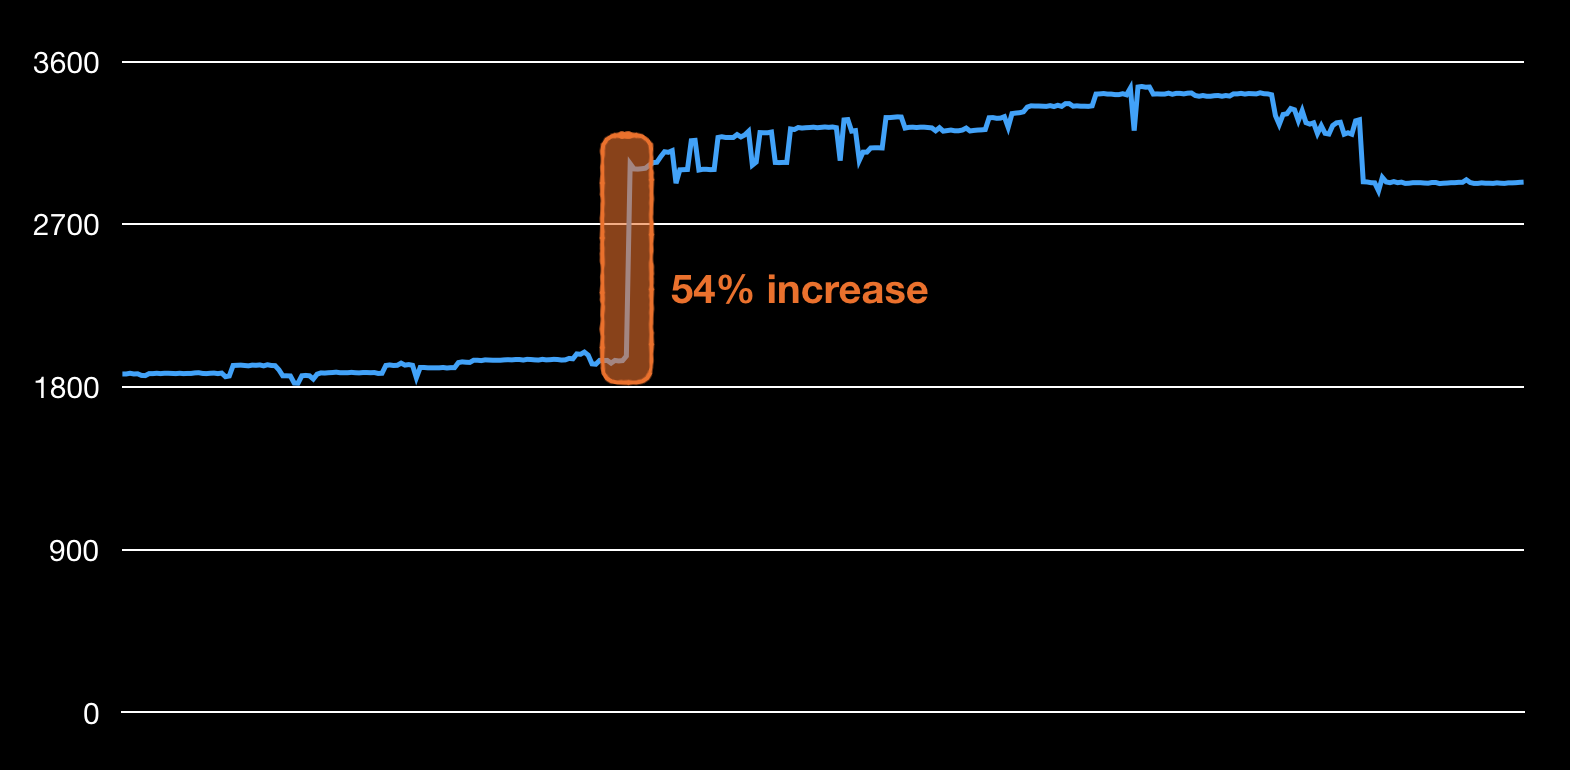
This is an example of the size of the application log file size plotted over six months, calculated after each commit. After a single commit the size grew with 54%. If the commit is small enough, you can even pinpoint the line responsible for the spike. The tests did not fail, but this can cause problems in production if disk space is limited or with CPU/memory resources if this log is parsed somehow.
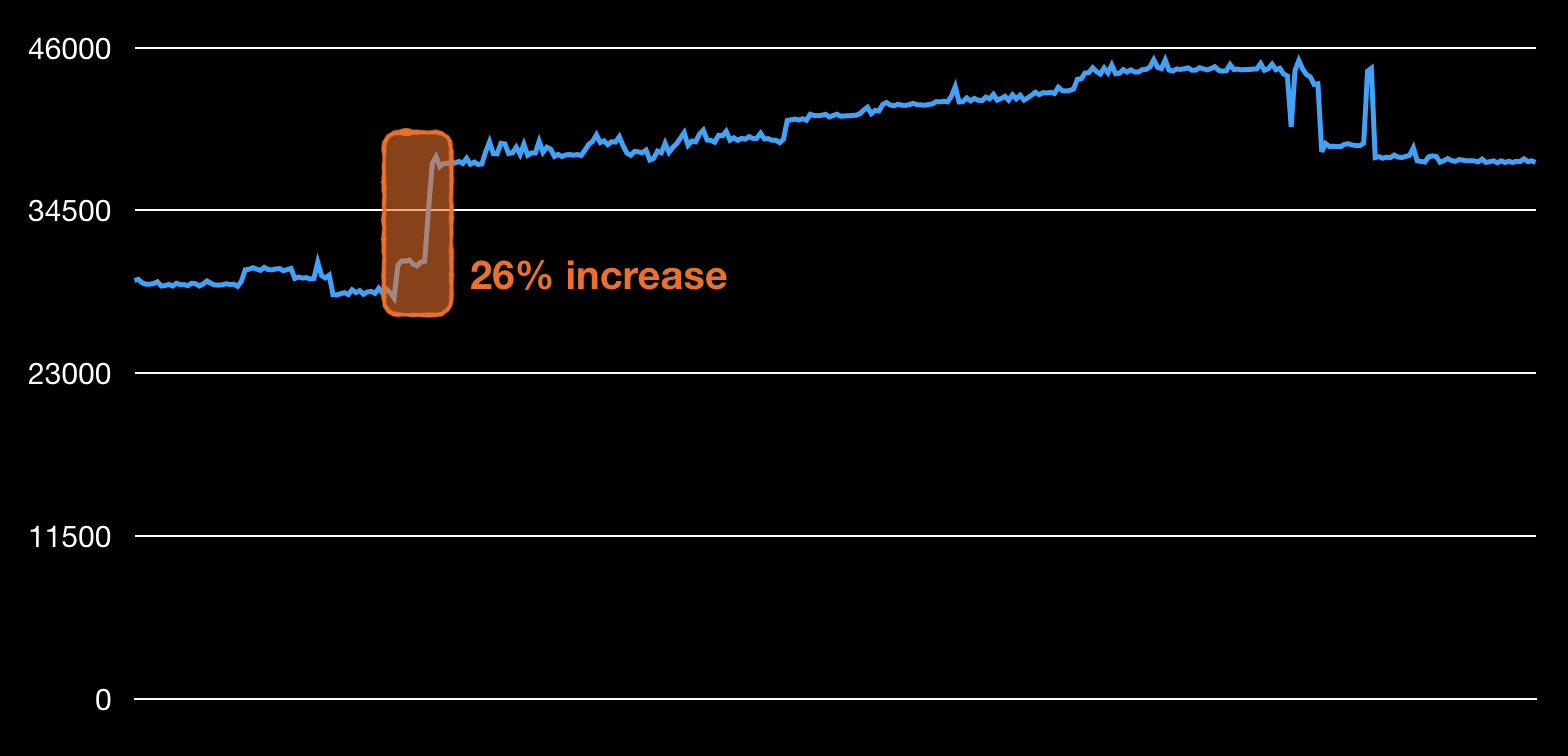
Next example is that of the number of db queries, in this case this is the sum of read and write operations. Again, this number is calculated after every commit and the values in the plot are from the last six months. A series of three commits were responsible for 26% spike in the queries. This may be completely normal behaviour, but to be certain a propper investigation is due.
Those metrics are not enough to fail a build the way the presence of exceptions or bad data is. But those metrics are very helpful to track and plot over time. They are a great way to know if the newly pushed code does not flood the logs with four times more data, or that it produces 50x DNS requests[14].
The best usage of those metrics would be to set an alarm at a certain threshold. For example, send a notification when a new commit causes the SQL read requests to jump more than three times compared to the previous commit. If you're sure that 3x increase is totally unacceptable, then why not just fail the build?
Bottom line: listen to the weak signals.
At least one high level automated tests per story
All of the techniques listed above depend on one thing — having good high level coverage by automated tests. Every feature, every corner of the application should have at least two test cases: one positive (a happy path) and one negative. Those tests should go through as much layers of the application as possible, including communications with internal services over the network and database operations. The six techniques listed above will extend and amplify from thereon.
15 years ago we were not concerned with the speed of testing that much because we were releasing to customers 2-3 times a year. ↩︎
This is also good for the employees, as no one likes to work on boring, repetitive tasks. ↩︎
Compared to low level, or unit tests ↩︎
Link to the tweet — brittle vs flaky ↩︎
Not much public data is shared on this matter. Maybe only Google has(link to the flaky tests blog post). ↩︎
This is what each test should do if you want to run them in parallel ↩︎
This was an online payments company ↩︎
Mentions need to be highlighted and contain clickable links ↩︎
As well as the other high level data formats such as JSON/XML ↩︎
Clear logs, restart services, flush all the data in persistent storage, start with clean DB schema. ↩︎
Most of the tests follow the AAA rule - Arrange, Act, Assert ↩︎
Note that this will never happen with unit tests as any exception on that level will cause the tests to fail immediately. ↩︎
There is a lot of magic in how PHP interprets true/false conditions (link) ↩︎
Those are real life examples, of before we had this system. We found out the hard way about them — in production. ↩︎